

If a coin listed at $1.00 is now trading at $0.10, is that a place to go long? I've wondered about this for a while, and it always felt a bit scary. So I backtested entering every one of these spots on Bybit from January 2022 to September 2026. That gave 295 trades and an average of +29.3% per entry. About one in three doubled and was closed in profit. But a handful of coins produced a big share of the gains, and 124 coins fell by half again after the entry.
Why I looked at this
A 90% drop sounded like most of the damage was already done. How much further could the last 10% go? I had already compared 70%, 80% and 90% drops side by side (Buying a coin after a 70% drop). This time I took the 90% spot and reran it with the exact exit rules I later put into live automated trading. The exits are different, so the numbers differ a little from that post.
Test setup
- Universe: every coin on Bybit USDT perpetuals, including delisted ones
- Period: January 2022 – September 2026 (4 years and 9 months)
- Reference: the close of the first 15-minute candle after listing is set to 100
- Entry: go long on the first candle that closes at or below 10 (a 90% drop). One entry per coin
- Exit 1: every 6 hours, check the close. If it's at or above 20, close. With the entry near 10, that means exiting at roughly 2x or more
- Exit 2: a limit order sits at 60 in the meantime, for sudden spikes
- Exit 3: 365 days after entry, close no matter what
- Stop loss: none
- Fees and funding included. Trades with no outcome by the end are valued at the end-of-September 2026 price
This is a backtest that assumes fills at 15-minute candle closes. It is not a live trading result.
One in three doubled
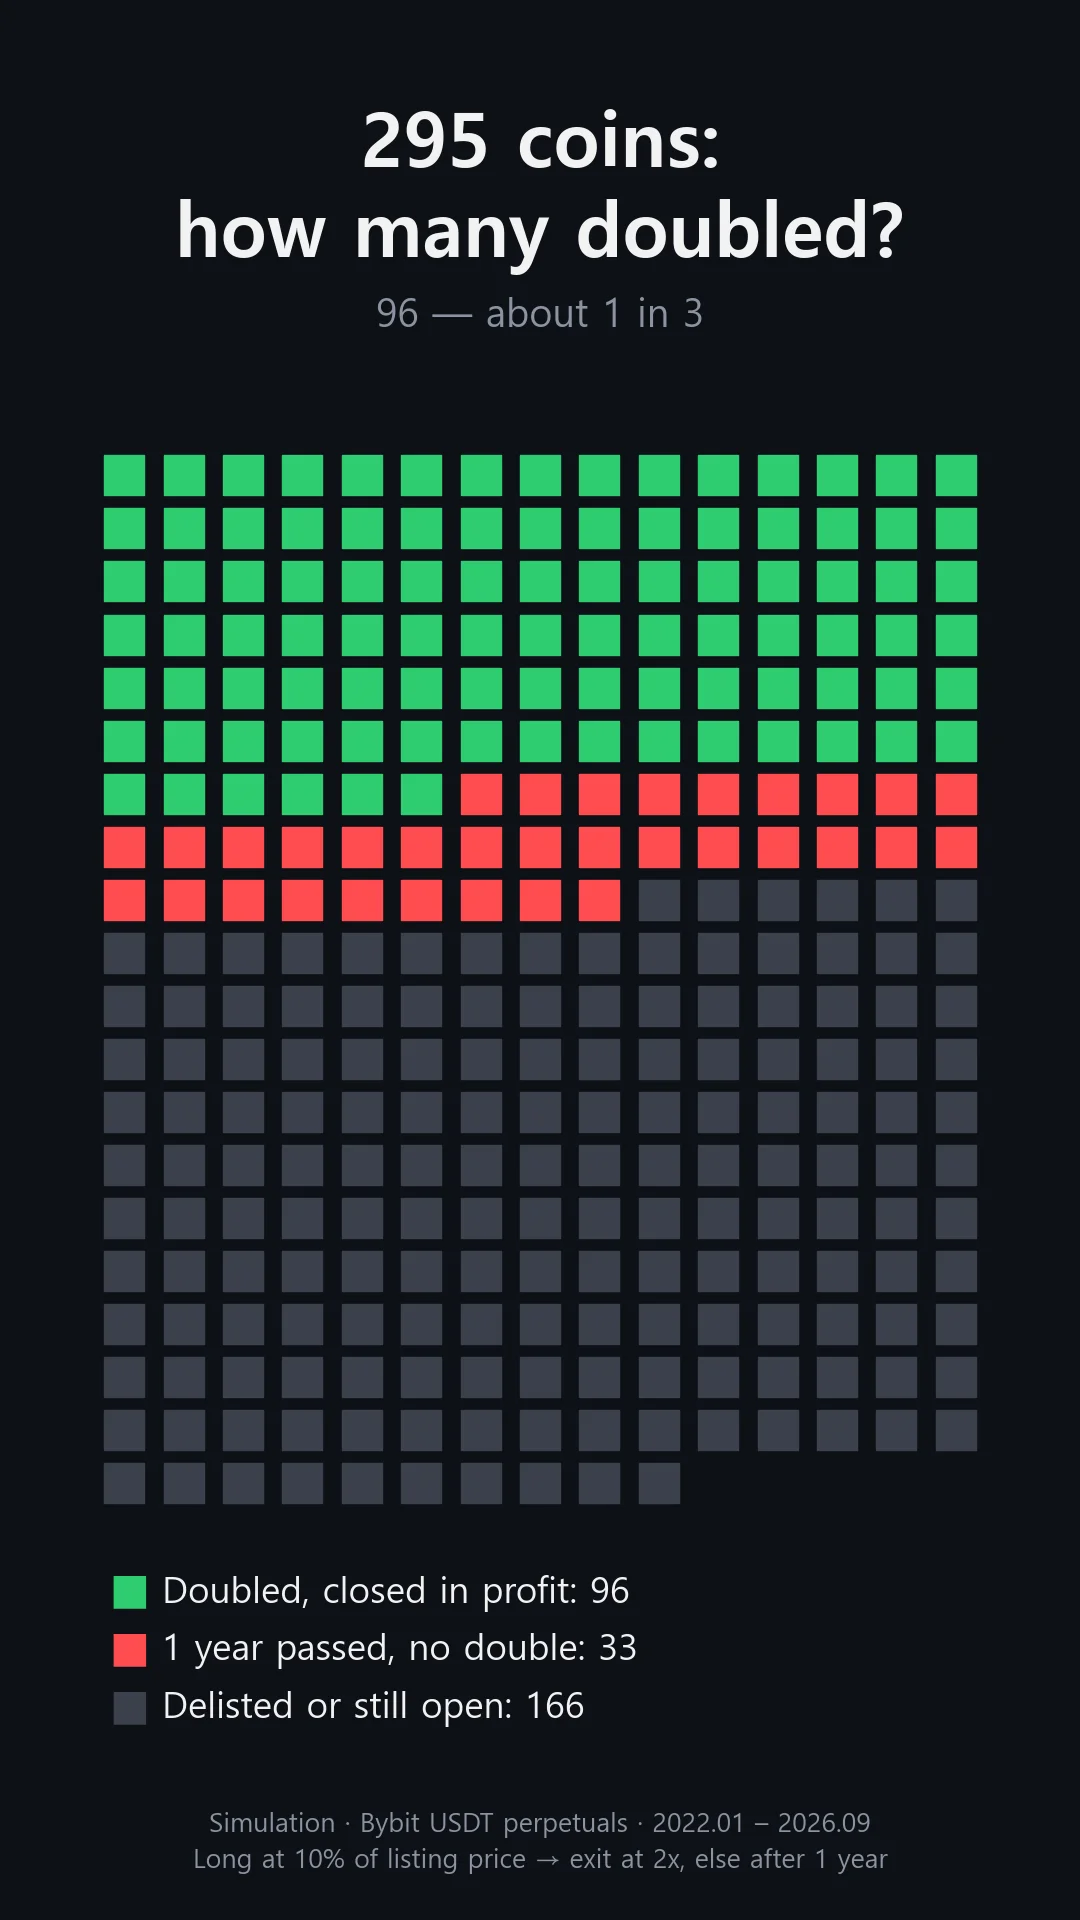
96 of the 295 trades (33%) closed above 2x. I honestly expected far fewer. They didn't take long, either. Half of those winners were closed within 43 days.
The rest split into two groups. 33 trades waited the full year without doubling and were closed at the deadline. 166 have no outcome yet: the coin was delisted, or the entry is less than a year old. A lot of entries happened in 2025 and later, which is why this group is so large.
+29% on average, by group
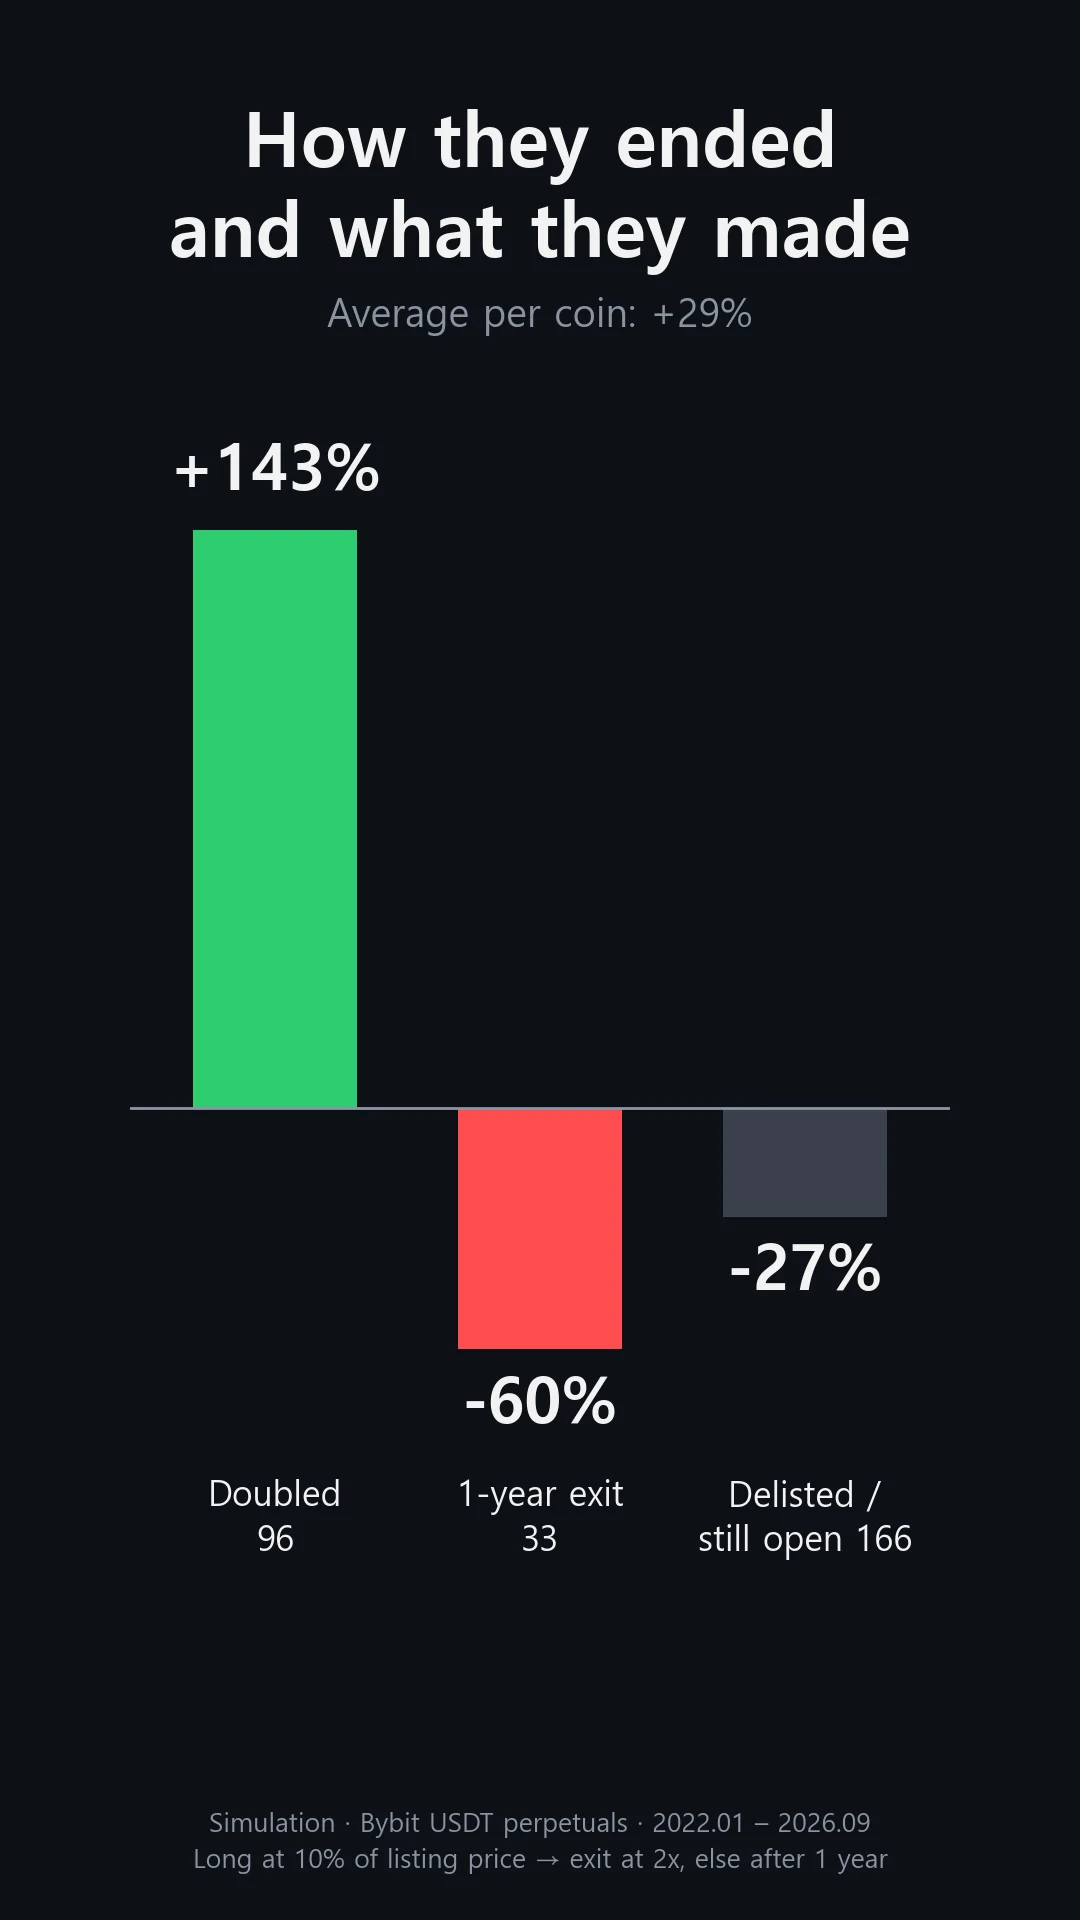
Here is the average price move for each group. The doubled trades average +143% because price is only checked every 6 hours, so many of them were well past 2x by the time they closed.
| How it ended | Trades | Average price move |
|---|---|---|
| Doubled, closed | 96 | +143% |
| Closed after 1 year | 33 | -60% |
| Delisted or still open (end-Sept price) | 166 | -27% |
| All (funding included) | 295 | +29.3% |
Read on its own, this table makes the spot look pretty good. That was my first reading too.
A few coins did the heavy lifting
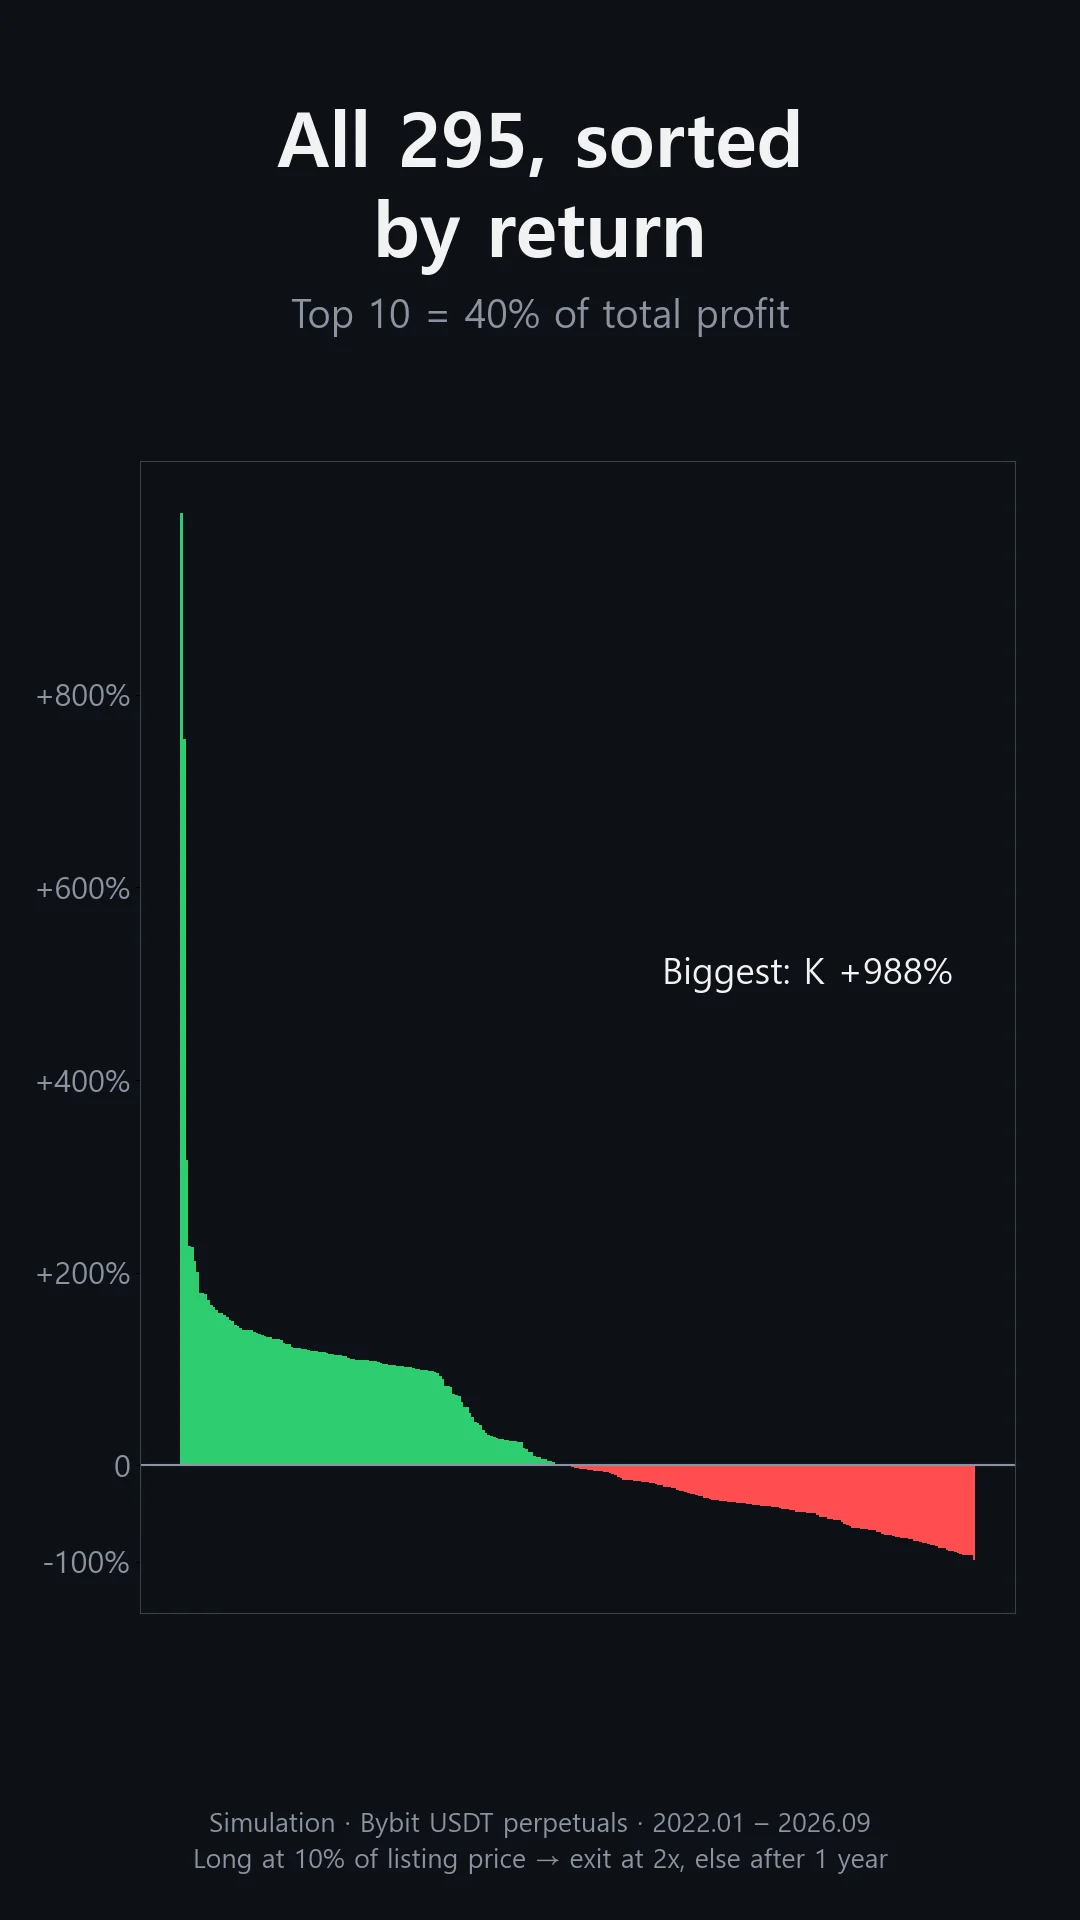
Sort all 295 trades by return and the picture leans hard to one side. The top 10 trades made 40% of the total profit. The biggest was a coin called K, entered on October 10, 2025 and closed seven days later at +988%.
Take out the top 5 and the average per entry drops from +29.3% to +21%. Still positive. Even so, 151 of the 295 trades lost money, which is more than half.
There was more floor below 90%
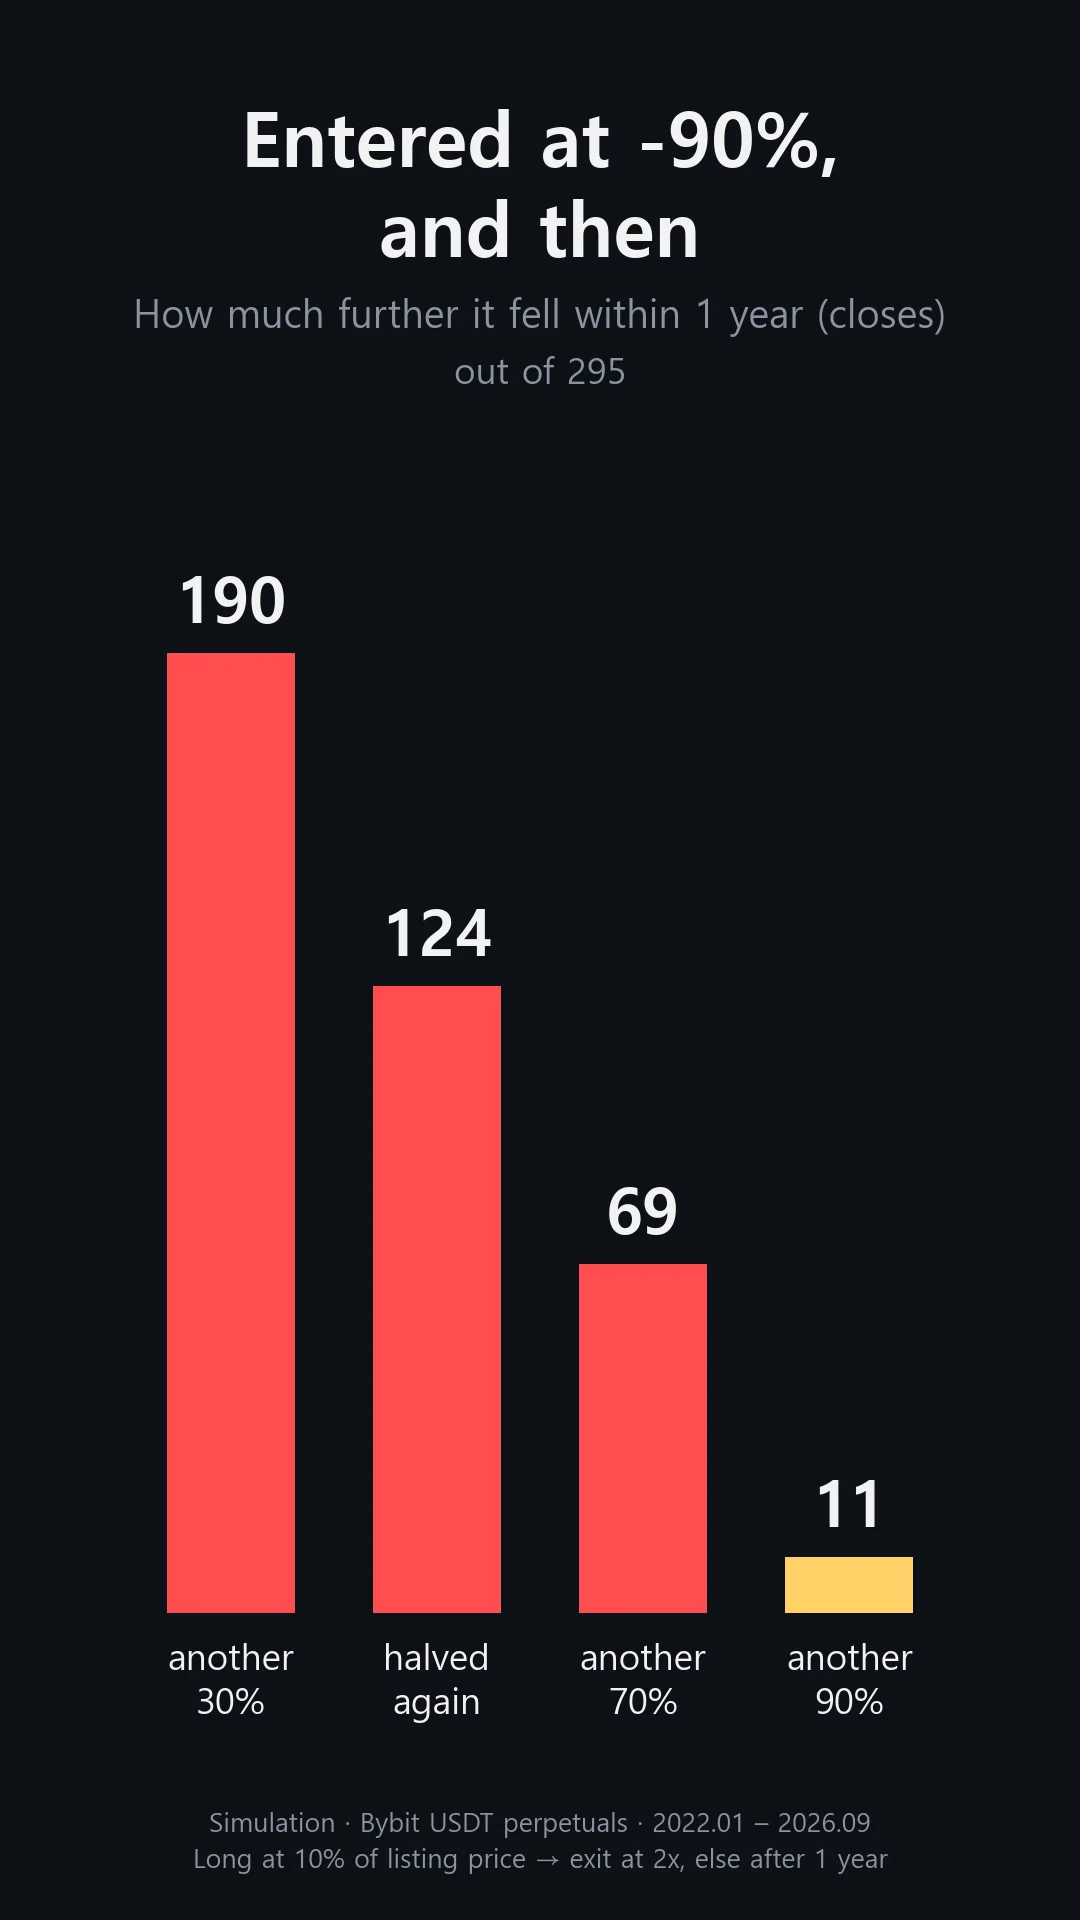
This part surprised me the most. I counted how much further each coin fell, on closing prices, within a year after the entry.
| Further drop from entry | Coins (out of 295) |
|---|---|
| 30% or more | 190 |
| 50% or more (halved) | 124 |
| 70% or more | 69 |
| 90% or more | 11 |
Put in listing-price terms: you enter a $1.00 coin at $0.10, and 124 of them went on to trade below $0.05. Eleven went below $0.01. With no stop loss, you sit through all of that. Some of these did come back and closed at 2x, but holding through it would not have felt good.
What I made of it
On average, the 90% drop was a spot worth entering in this test. One in three doubling was higher than I expected.
But the average rests on a small number of big winners. Picking one or two coins and hoping for this result doesn't line up with how the gains were made. If most of the profit comes from a few trades, I think it means spreading entries across many coins and sizing each one so you can live with it falling a long way.
It also cured me of the "it's down so much, this must be the bottom" feeling. 90% wasn't the bottom. Nearly two out of three coins fell more than another 30% from there.
Caveats
- The 166 unresolved trades are valued at the end-of-September price. If all of them ended like the one-year exits, at -60% on price, the average per entry would fall to about +7%. The +29% reflects current prices and may change.
- Entries bunched up on market-wide crash days. 45 trades were entered on October 10, 2025 alone, and 170 of the 295 were entered in 2025. One period weighs heavily on the result.
- Coins down 90% can be thinly traded. Real fills may be worse than in the test, and I couldn't verify that in simulation.
- I put this rule into live trading on October 5, 2026. There are no live results yet.
Nothing here is investment advice. Crypto is volatile, and past results don't guarantee future returns.