

When a newly listed coin loses half its value and then climbs all the way back to its listing price, is that a good place to go long? I tested it on Bybit coins listed since 2022. My first rule made an average of +6.5% per entry over 236 trades. After three changes, the final rule made +13.8% per entry over 207 trades. Both numbers are after fees and funding. The win rate is 49%, though. Half the trades lose, and the money comes from how big the winners are.
Why I looked at this
Most people would say a coin that has already recovered to its old price is a late entry. I had the opposite hunch.
Halving after listing is extremely common. Of the 892 coins listed on Bybit between January 2022 and September 2026, 643 (72%) closed below half their listing price at some point. Only 236 of those made it back above the listing price, a bit more than one in three (37%). The median time from the drop to the recovery was 87 days.
If most coins never come back from there, I figured the ones that do might have something going for them.
Test setup
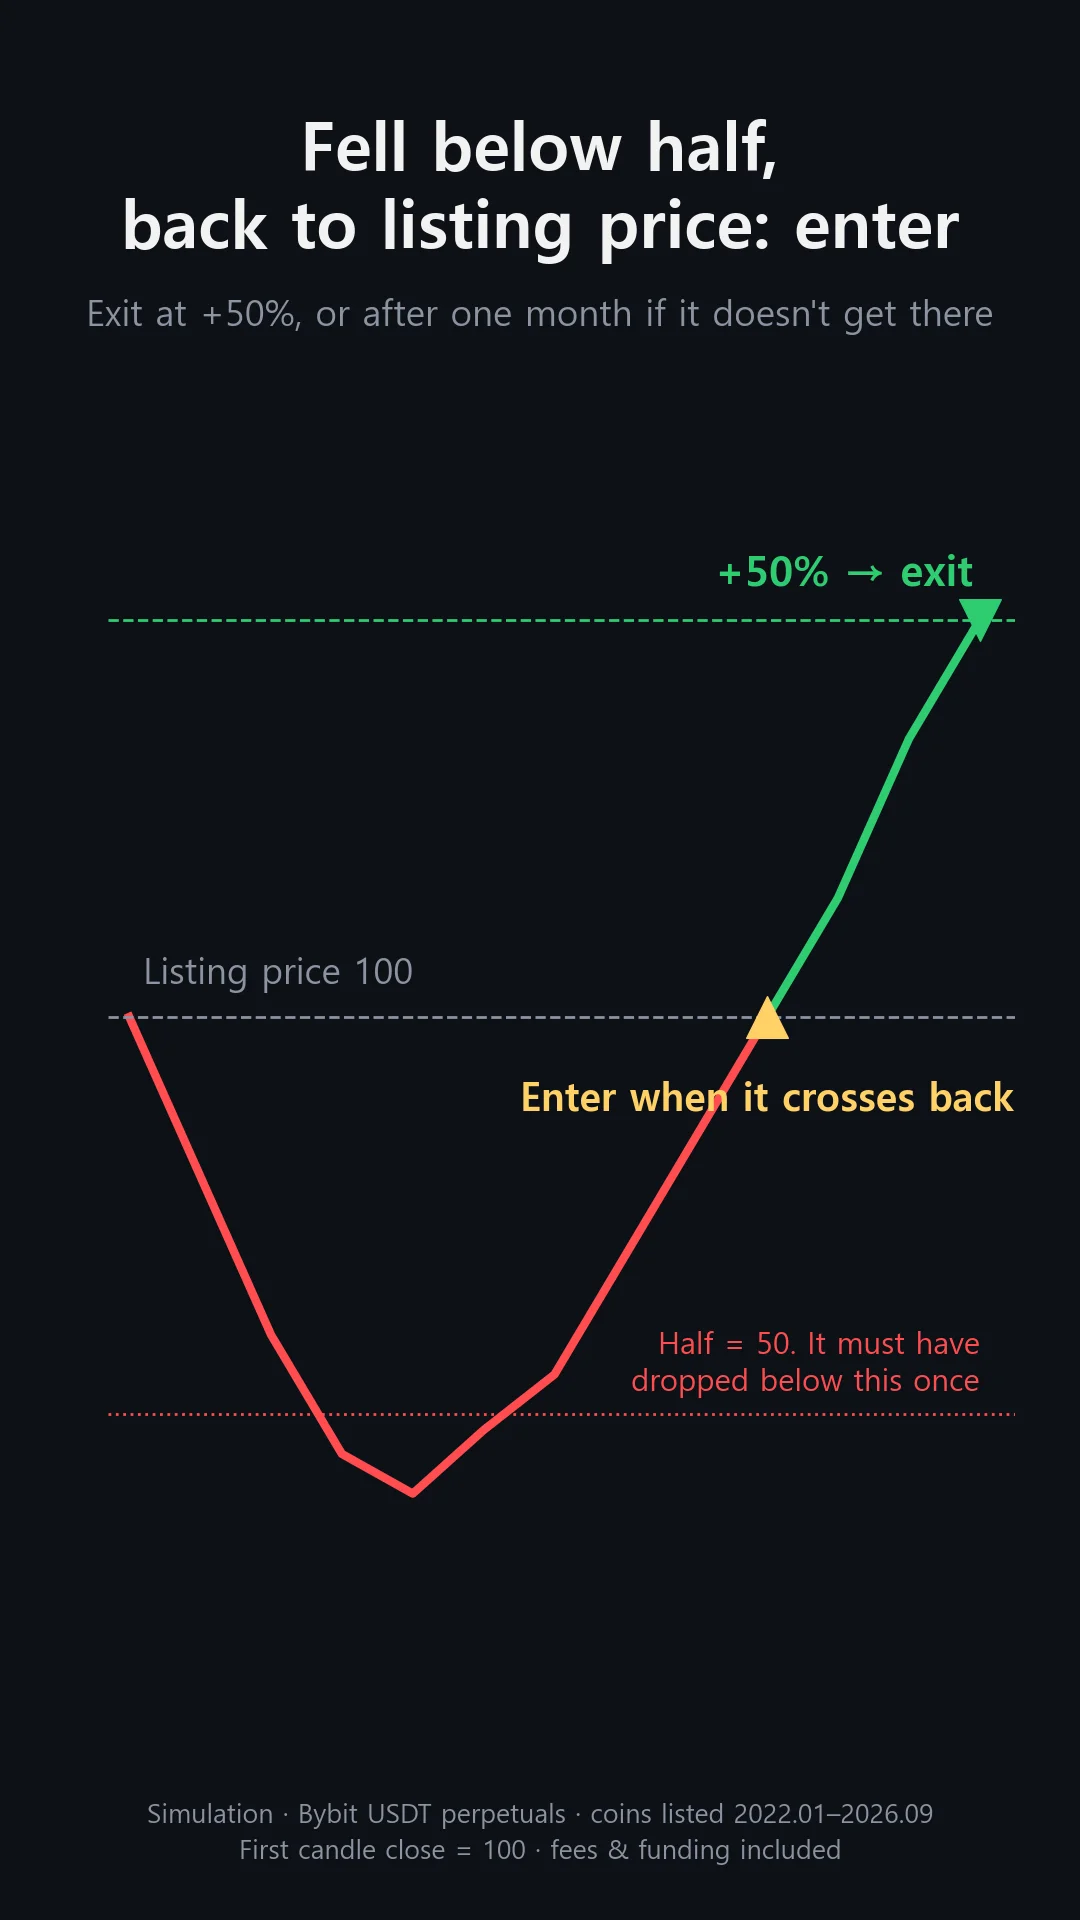
The first rule is exactly what the chart shows.
- Universe: coins listed on Bybit USDT perpetuals from January 2022 to September 2026, delisted coins included
- Reference: the close of the first 15-minute candle after listing is the listing price, set to 100
- Watch list: only coins that have closed below 50 at some point
- Entry: go long on the first candle that closes back at or above 100. One entry per coin
- Exit: a limit order at 150. If it isn't filled within 30 days, close on day 30
- No stop loss. Fees and funding included
This is a backtest on 15-minute candles, not live trading.
First result: +6.5% per trade
236 entries, +6.5% on average, 55% win rate. 111 trades reached the take-profit at 150, a little under half.
My first reaction was relief that the idea held up. Then something bothered me. I was exiting winners at +50%, yet the average was only around 6%. The trades that never got there were eating a lot of it. So I changed one condition at a time and reran the test. I ran it several times that day and kept the three changes that helped.
| Step | Change | Trades | Avg per entry |
|---|---|---|---|
| Start | Enter above 100, exit at 150 | 236 | +6.5% |
| 1 | Skip coins that had doubled before falling | 185 | +8.2% |
| 2 | Enter above 90 instead of 100 | 207 | +10.4% |
| 3 | Take profit at 170 instead of 150 | 207 | +13.8% |
Change 1: skip coins that already had a big run
I split the 236 trades by how high each coin had gone before it fell below 50. You know this at the moment of entry.
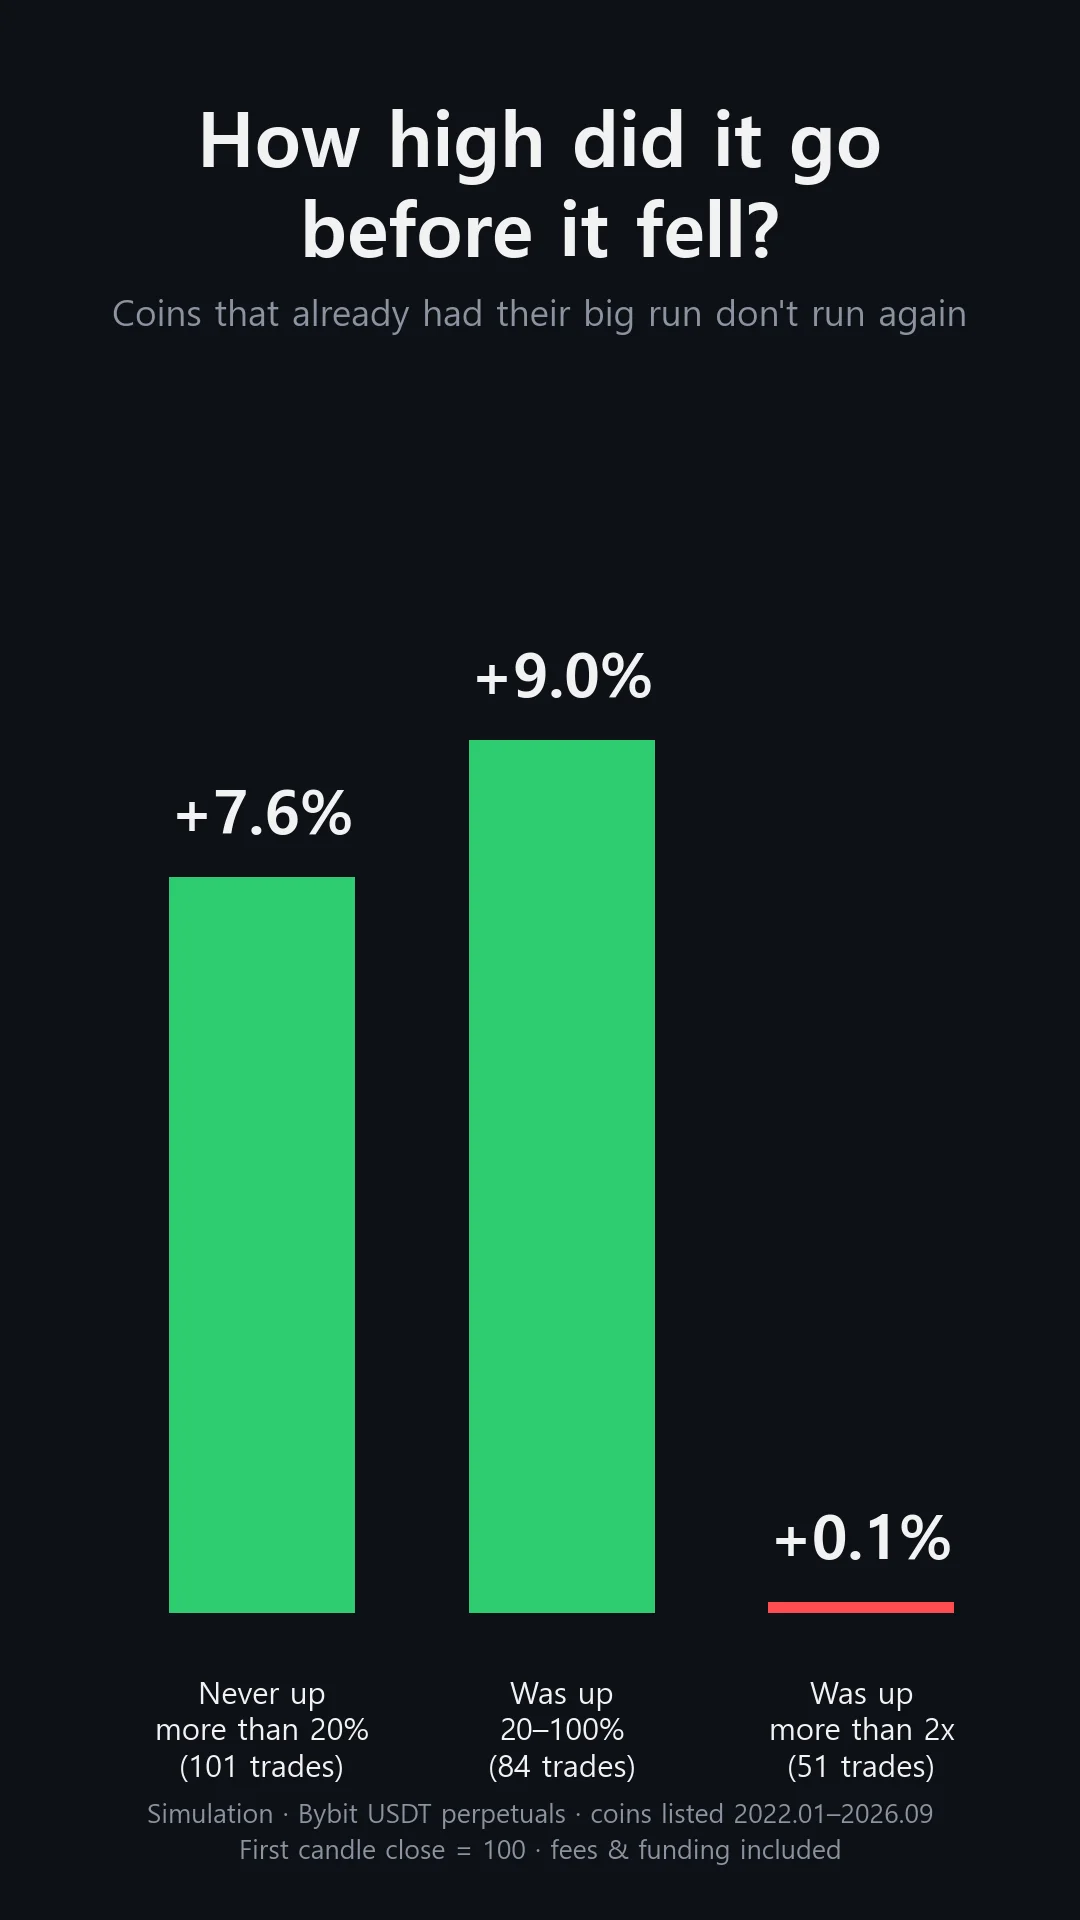
The 51 trades on coins that had more than doubled before falling averaged +0.1%. Basically break-even. The other two groups made +7.6% and +9.0%. Those 51 coins took a median of 242 days to fall below 50 after their peak. For a coin that ran up hard and then bled out over eight months, the listing price is less than half its old high. Getting back above it didn't mean much.
Removing them left 185 trades at +8.2%.
Change 2: enter 10% below the listing price
Next I looked at where to enter. Instead of waiting for 100, I tried entering when price crossed 80, 85, 90 or 95. Take-profit stayed at 150, and coins that had doubled were still excluded.
| Entry level (listing = 100) | Trades | Avg per entry |
|---|---|---|
| 80 | 244 | +6.0% |
| 85 | 225 | +7.3% |
| 90 | 207 | +10.4% |
| 95 | 199 | +8.9% |
| 100 | 185 | +8.2% |
90 came out on top. Entering a little cheaper stretched the distance to 150 from +50% to +67%. Trades that didn't get there and closed on day 30 lost less, too: -21% on average instead of -29%. 80 was too early. It picked up coins that reached 80 and turned back down, and the win rate fell to 42%.
My original idea was "the moment it crosses the listing price." The data preferred a bit earlier. My guess is that a lot of coins stall right around the listing price.
Change 3: take profit at 170 instead of 150
Last was the exit. Keeping the entry at 90, I changed only the take-profit level.
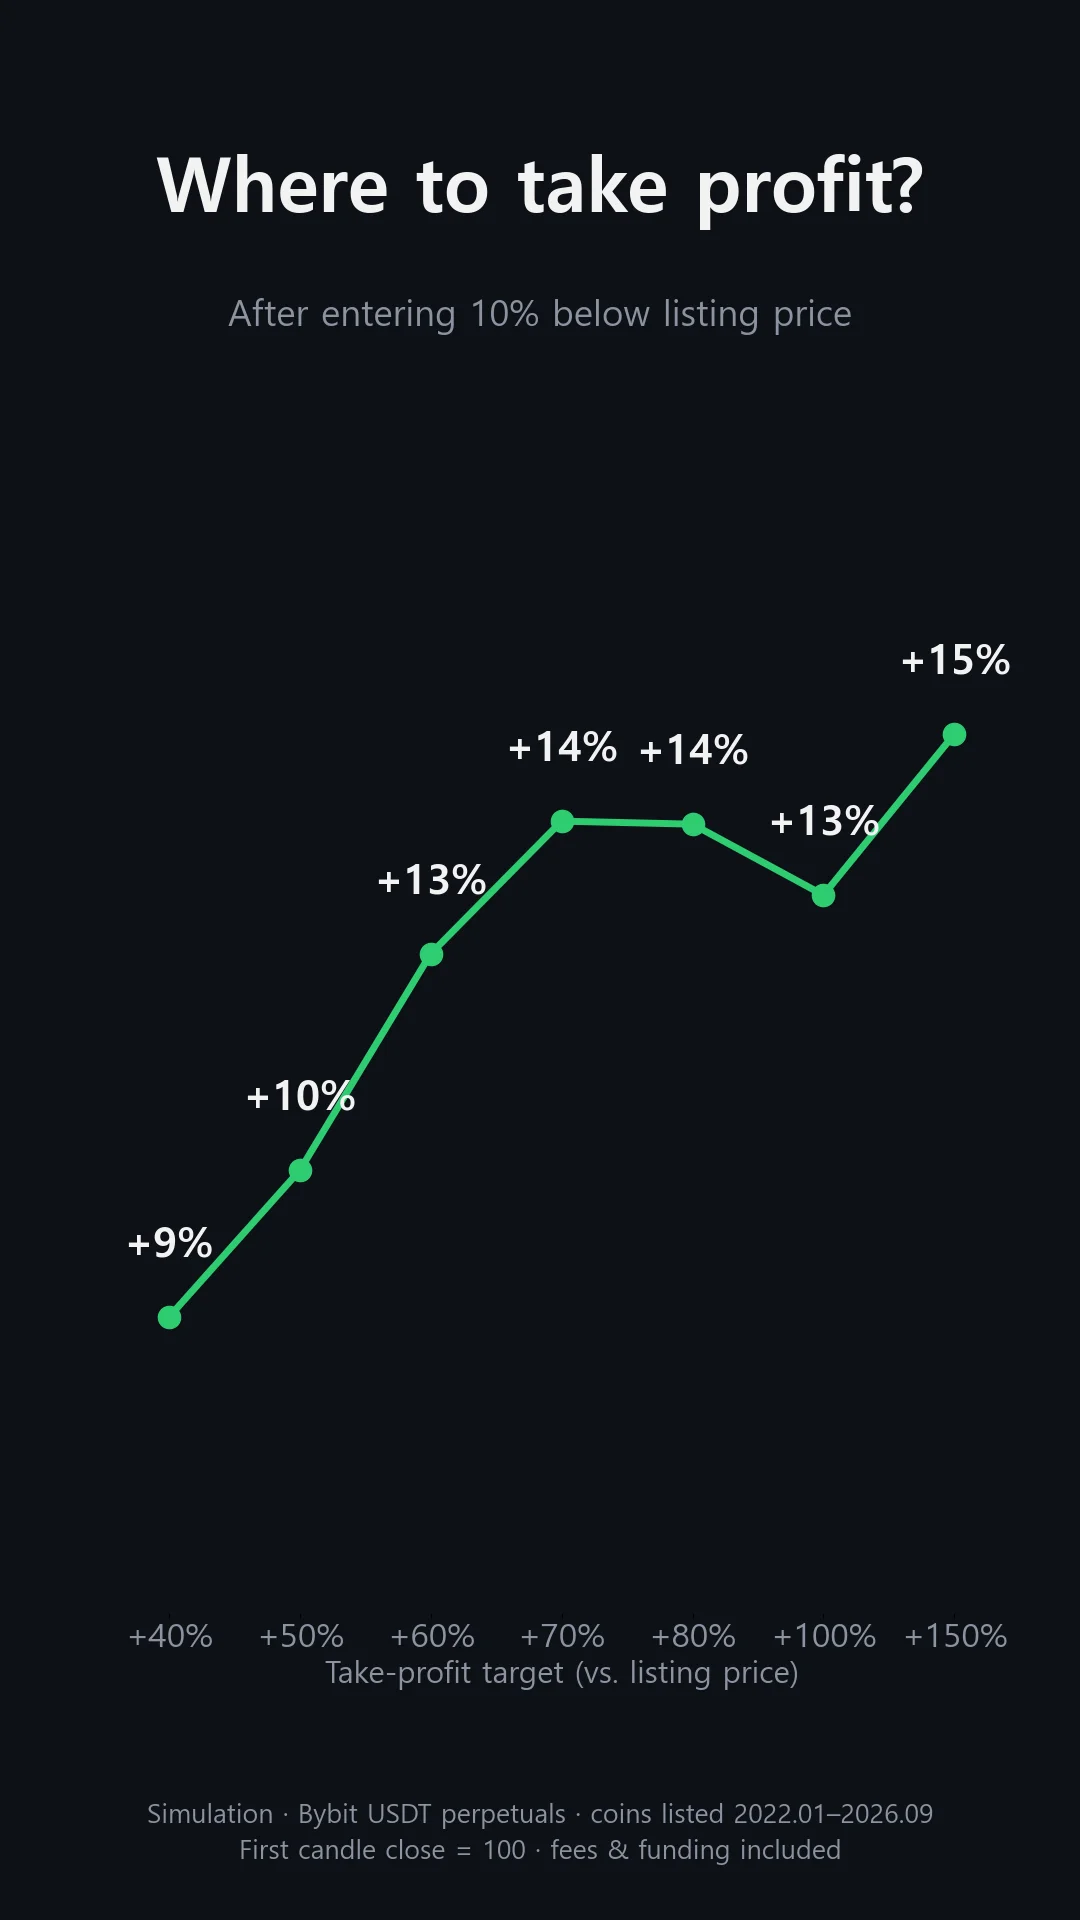
Everything from 160 to 200 landed between +12.5% and +13.8%, with 170 and 180 tied at the top (+13.8%). Coins that got past 150 usually kept going to 170–180. The point at the far right, 250 (+150%), shows a higher average of +14.7%. But only 27 of 207 trades reached it, so that number leans heavily on a few trades. I went with 170.
How the final rule did
Here is the final rule in one paragraph. Take coins that fell below half their listing price and had never more than doubled before that. When one closes back above 90, go long. Exit with a limit order at 170, or on day 30 if it doesn't fill.
| Metric | Value |
|---|---|
| Trades | 207 (about 3.6 per month) |
| Avg per entry | +13.8% |
| Win rate | 49% |
| Exited at 170 | 68 trades, about +80% on average |
| Closed on day 30 | 139 trades, about -20% on average |
| Without the top 5 trades | +11.7% |
I also checked whether a few huge trades were carrying the average. Without the five best, it was still +11.7%. The single worst trade lost 86%.
Split by year, the average was positive in all five years. Trades are counted in the year they were entered.
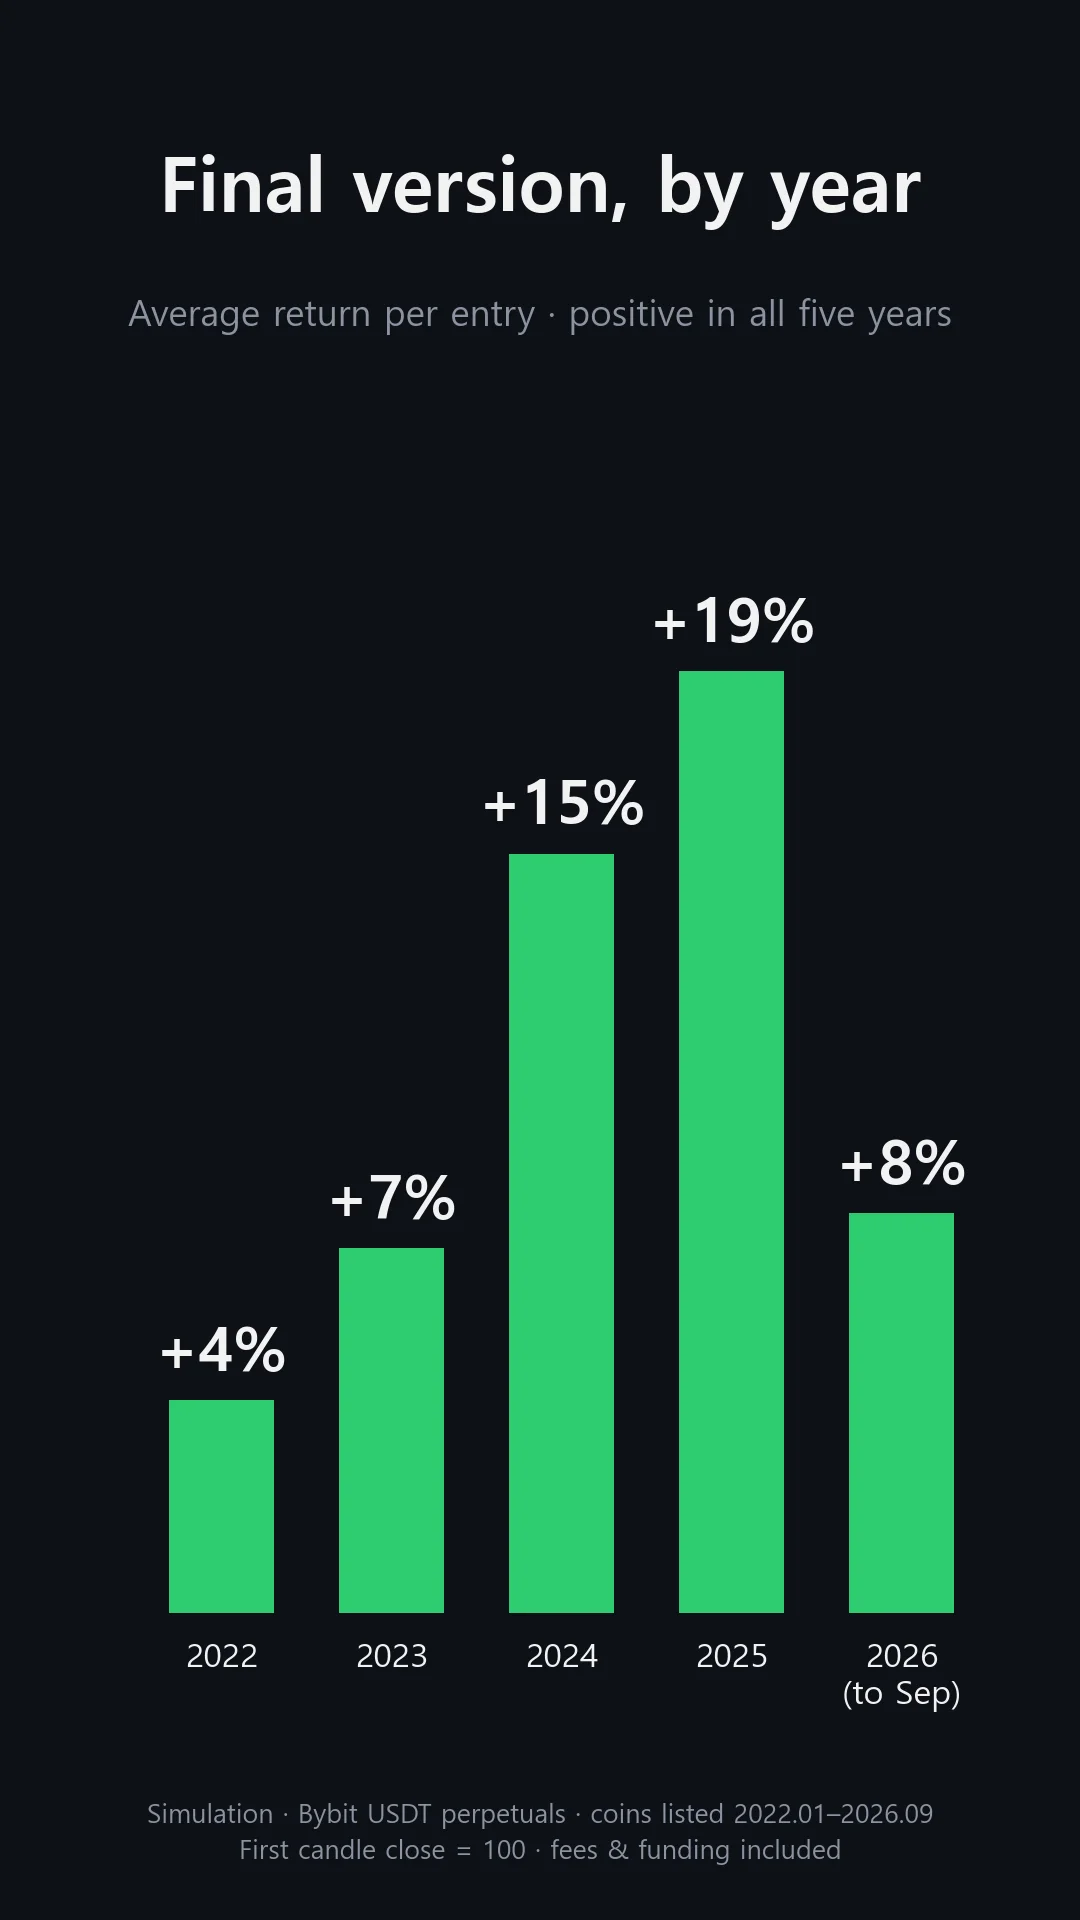
| Year | Trades | Avg per entry |
|---|---|---|
| 2022 | 6 | +4.2% |
| 2023 | 24 | +7.2% |
| 2024 | 93 | +15.0% |
| 2025 | 56 | +18.6% |
| 2026 (through Sep) | 28 | +7.9% |
What I took from it
A halved coin getting back to its listing price is rare, and the ones that did often pushed higher again within a month. So my first hunch was roughly right.
It still isn't a spot where you just get in and wait. Half the trades ended about 20% down after 30 days, and the +80% winners at 170 are what cover those losses. Putting everything on one or two coins would make this mostly a matter of luck.
Choosing the conditions taught me something too. Coins that all "reclaimed the listing price" behaved very differently depending on the path they took to get there. The ones that had already run up and collapsed only broke even.
Caveats
- All three improvements were picked by rerunning the test on the same data. They may be fitted to this period, so future results could be weaker.
- 2022 had only six trades, so that year's average doesn't say much. The busiest year was 2024, with 93.
- There are only 3–4 trades a month, simply because few coins climb back near their listing price.
- I started running this rule live on October 5, 2026, in two versions (take-profit at 170 and at 180). There are no live results yet.
- The backtest assumes fills at 15-minute candle closes. Real fills may be worse.
Nothing here is investment advice. Crypto is volatile, and past results don't guarantee future returns.