

Imagine putting real money into a trading bot, waiting a year, and only then finding out the strategy was bad. I skip that year with a simulation. I run the strategy on historical data exactly as it would have traded, and four years of results come back in about 8 minutes. It can't tell me what the future holds. What it does is catch bad strategies before they cost me anything, and that's most of why I use it.
Testing live takes a year
The only way to judge a strategy live is to fund it and wait. If you want to know how it does over a year, you wait a year. Over four years, you wait four. Whatever you lose along the way stays lost.
A simulation, or backtest, works on a simple idea: go back in time and trade the strategy. Candle by candle, it works out which coin the strategy would have entered that day and when it would have exited.
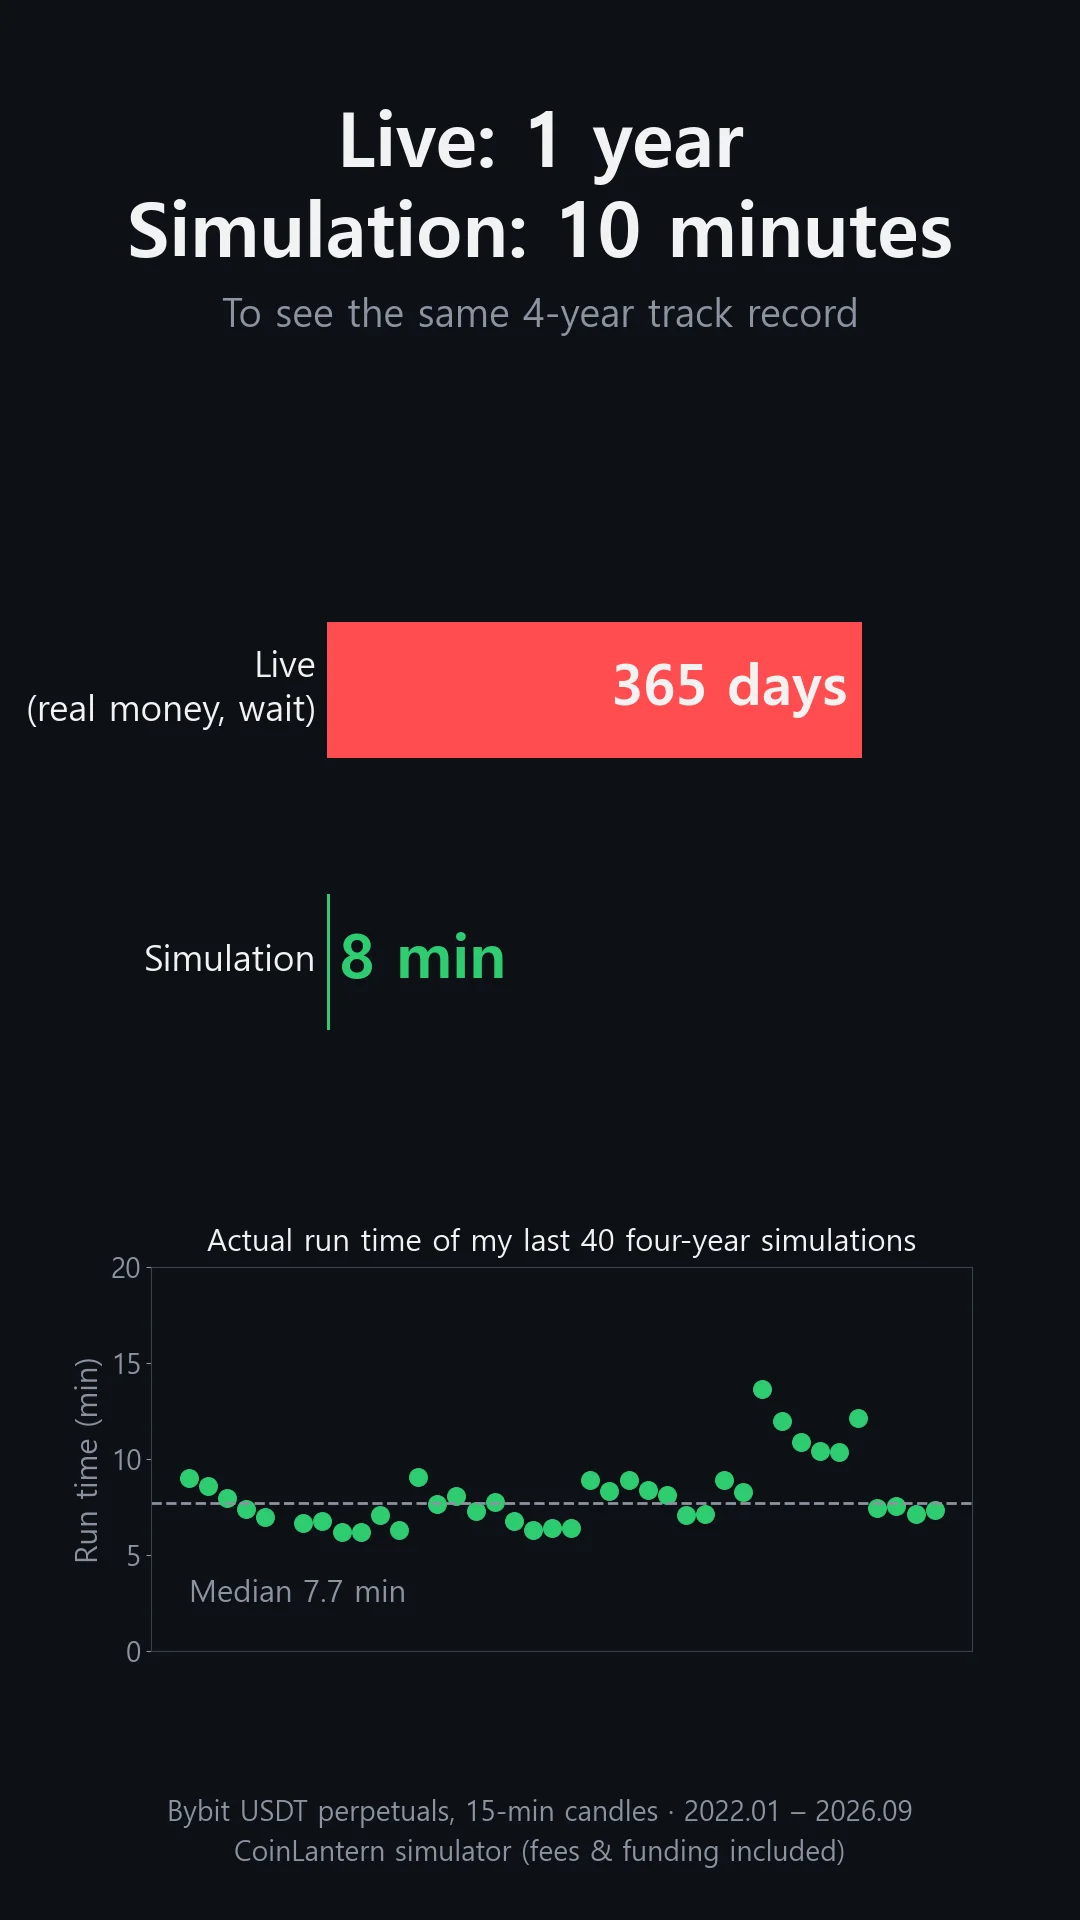
The dots at the bottom are the actual run times of the last 40 four-year simulations I ran. The median was 7.7 minutes, and most finished in 6 to 9. Seven of the 40 took longer than 10 minutes. Those were runs with several strategies at once.
The data: 1,675 coins, 67 million candles
I downloaded every 15-minute candle for Bybit's USDT perpetual futures from January 2022 on. That's 1,675 coins and about 67 million candles. Delisted coins and stock futures are included.
Keeping the delisted coins matters. If you only test on coins that still exist, you quietly drop every trade into a coin that died, and the results look better than they really were.
| Year | 15-min candles | Coins with candles |
|---|---|---|
| 2022 | 5.6M | 190 |
| 2023 | 8.0M | 301 |
| 2024 | 14.4M | 693 |
| 2025 | 21.0M | 990 |
| 2026 (to Sep) | 18.2M | 1,137 |
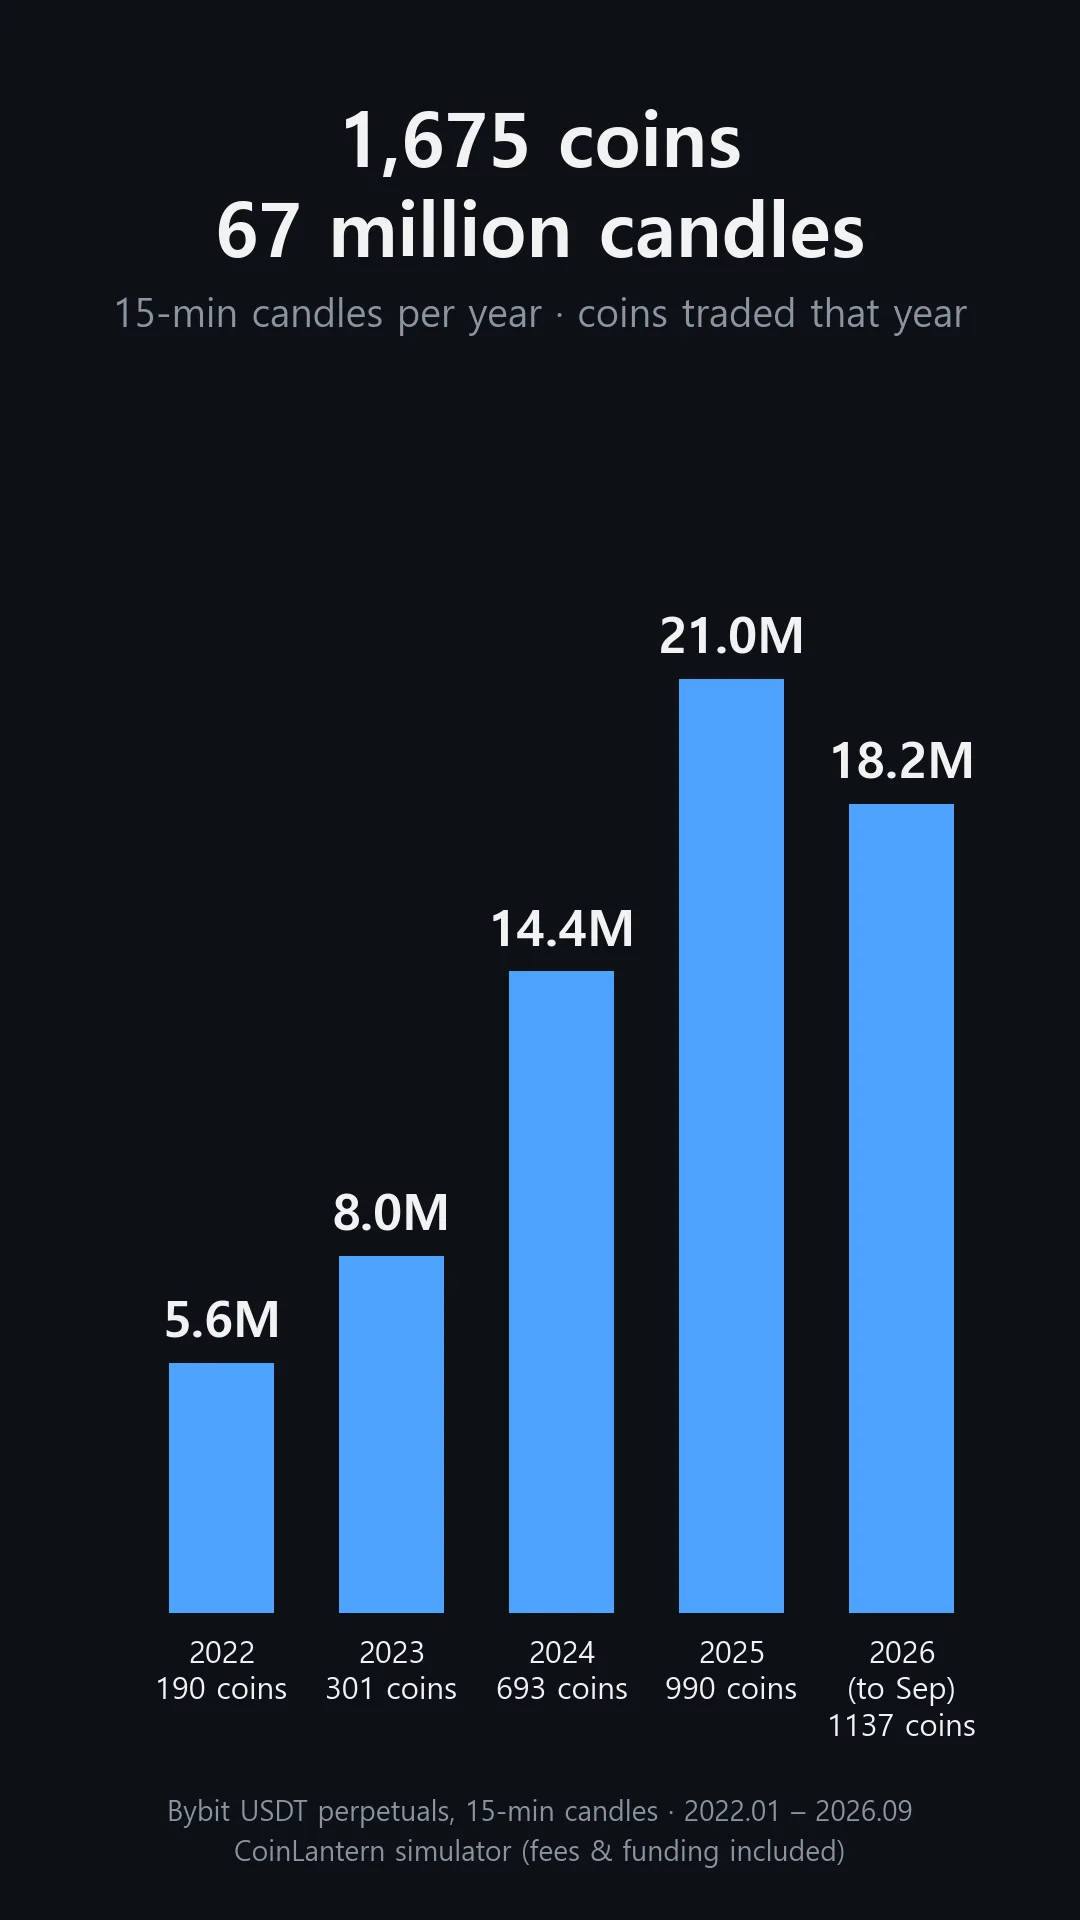
The count grows every year because Bybit kept listing more coins.
The exchange gives this data away for free. Bybit's public API serves historical candles with no login. Still, being able to download it isn't the same as having it. Building four years of 15-minute history for more than 1,600 coins took me several days. Once it's stored, I reuse it as often as I like.
What the simulator does
My simulator reads those candles in time order and runs the strategy once every 15 minutes. It starts at midnight on January 1, 2022, and at every candle it asks: enter now, or exit something I'm holding?
It deducts trading fees on every trade. It also includes funding. Funding is the payment longs and shorts exchange at set intervals on perpetual futures, and for strategies that hold for weeks it adds up. So I store the exchange's actual funding history and apply what a position would have paid or received while it was open.
Four years of trades in 8 minutes
Here's one strategy I actually tested. It goes long on a coin that once fell below half its first 15-minute candle price after listing, at the moment it climbs back above 90% of that price. It exits at 170% of the first-candle price, or after 30 days if that target never comes. Coins that had already doubled from the first candle are skipped.
Backtest from January 2022 to September 2026, fees and funding included:
| Item | Value |
|---|---|
| Trades | 207 |
| Average return per trade | +13.8% |
| Winning trades | 101 (49%) |
| Per-trade returns simply added up | +2,861% |
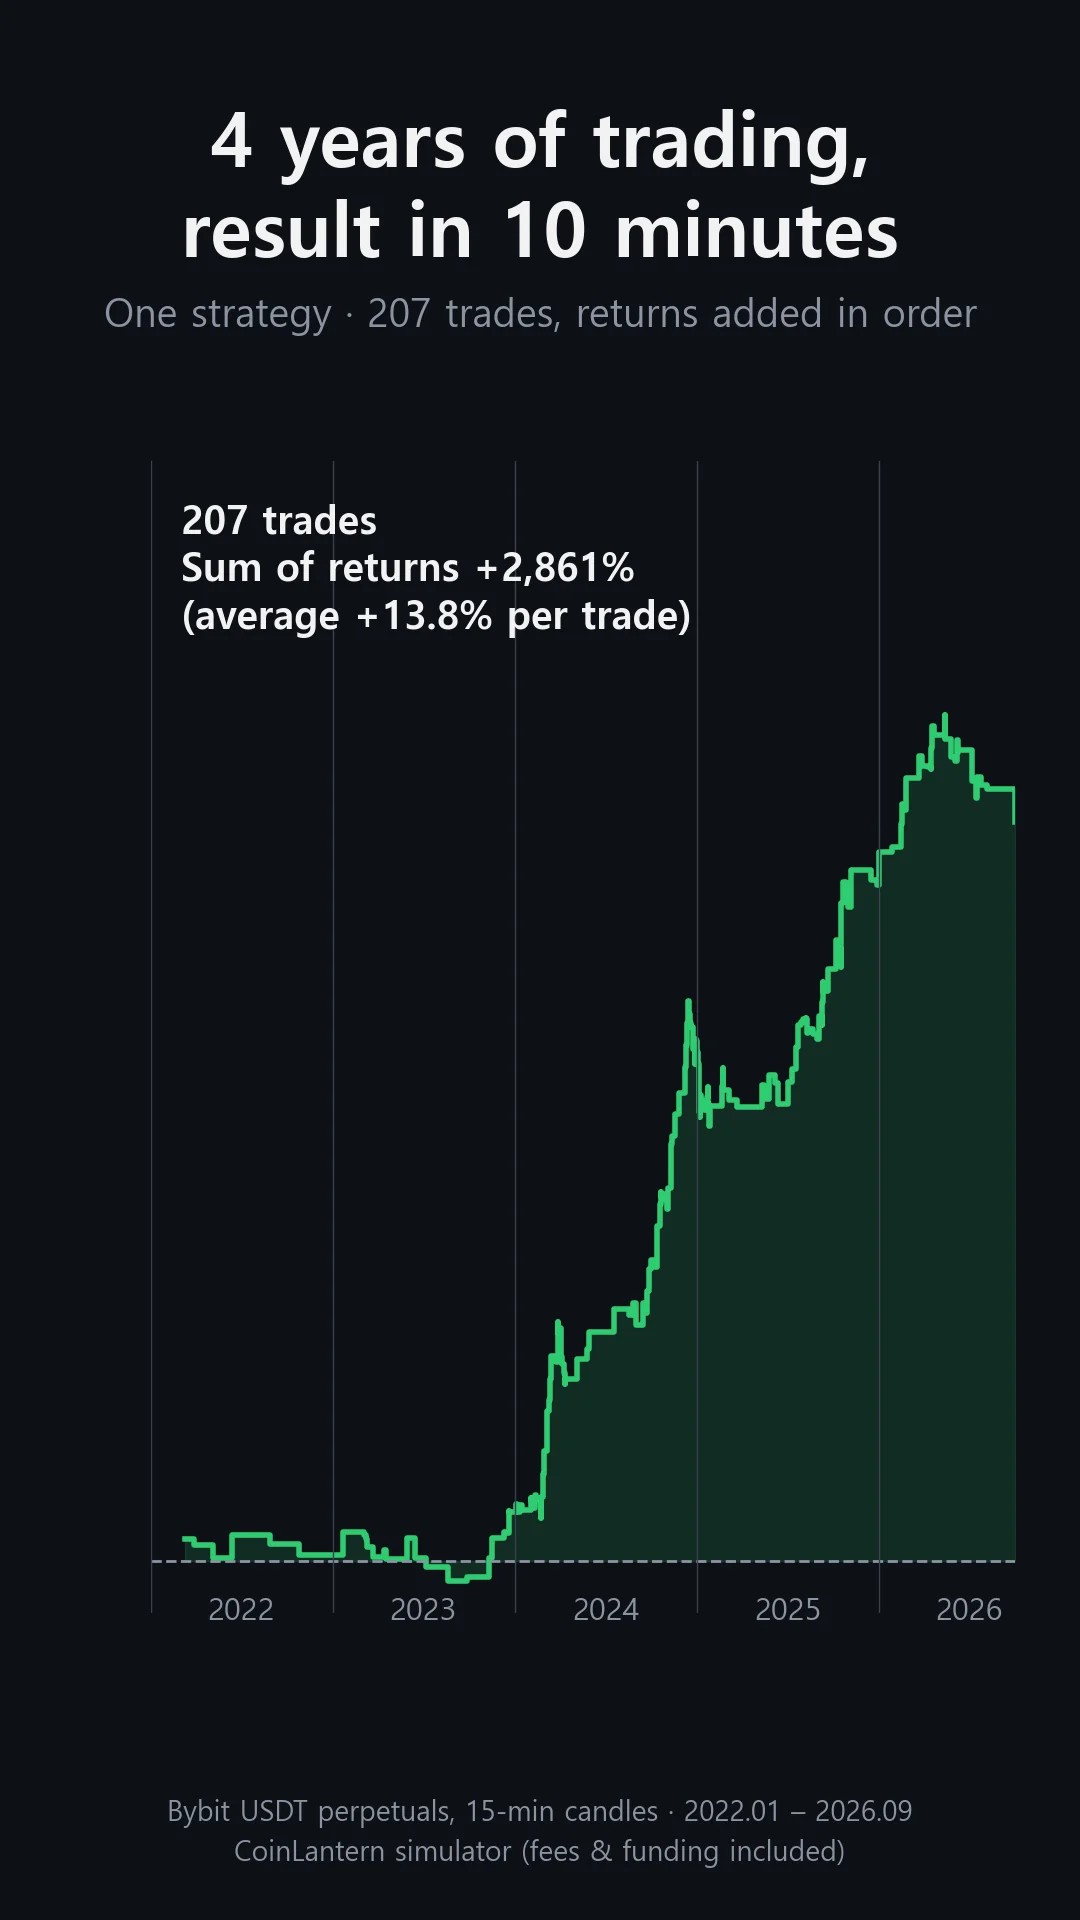
That +2,861% doesn't mean the money grew 28 times. It's just the 207 returns added together. The number that means something is the +13.8% average per trade.
What I look at first is the shape of the line. Through the end of 2023 there were 26 trades with a combined +191%, and the line barely moves. It only gets steep in 2024. So the same strategy would have felt completely different depending on when you started. Had I gone live in 2022, I'd have sat through almost two years of very little. A single final number hides that. Live, you'd only learn it after living through those two years.
Those four years had every kind of market
Will a strategy that made money in the past keep making it? Nobody knows. But this period (four years and nine months from January 2022, to be exact) covered a lot of ground.
| When | Bitcoin |
|---|---|
| Jan 2022 | $46,327 |
| Nov 2022 | $15,855, the low of the period (Luna and FTX collapses) |
| 2023 | Sideways |
| 2024 | Rising |
| Oct 2025 | $124,698, the high of the period, then a sharp drop |
| Sep 2026 | $83,496 |
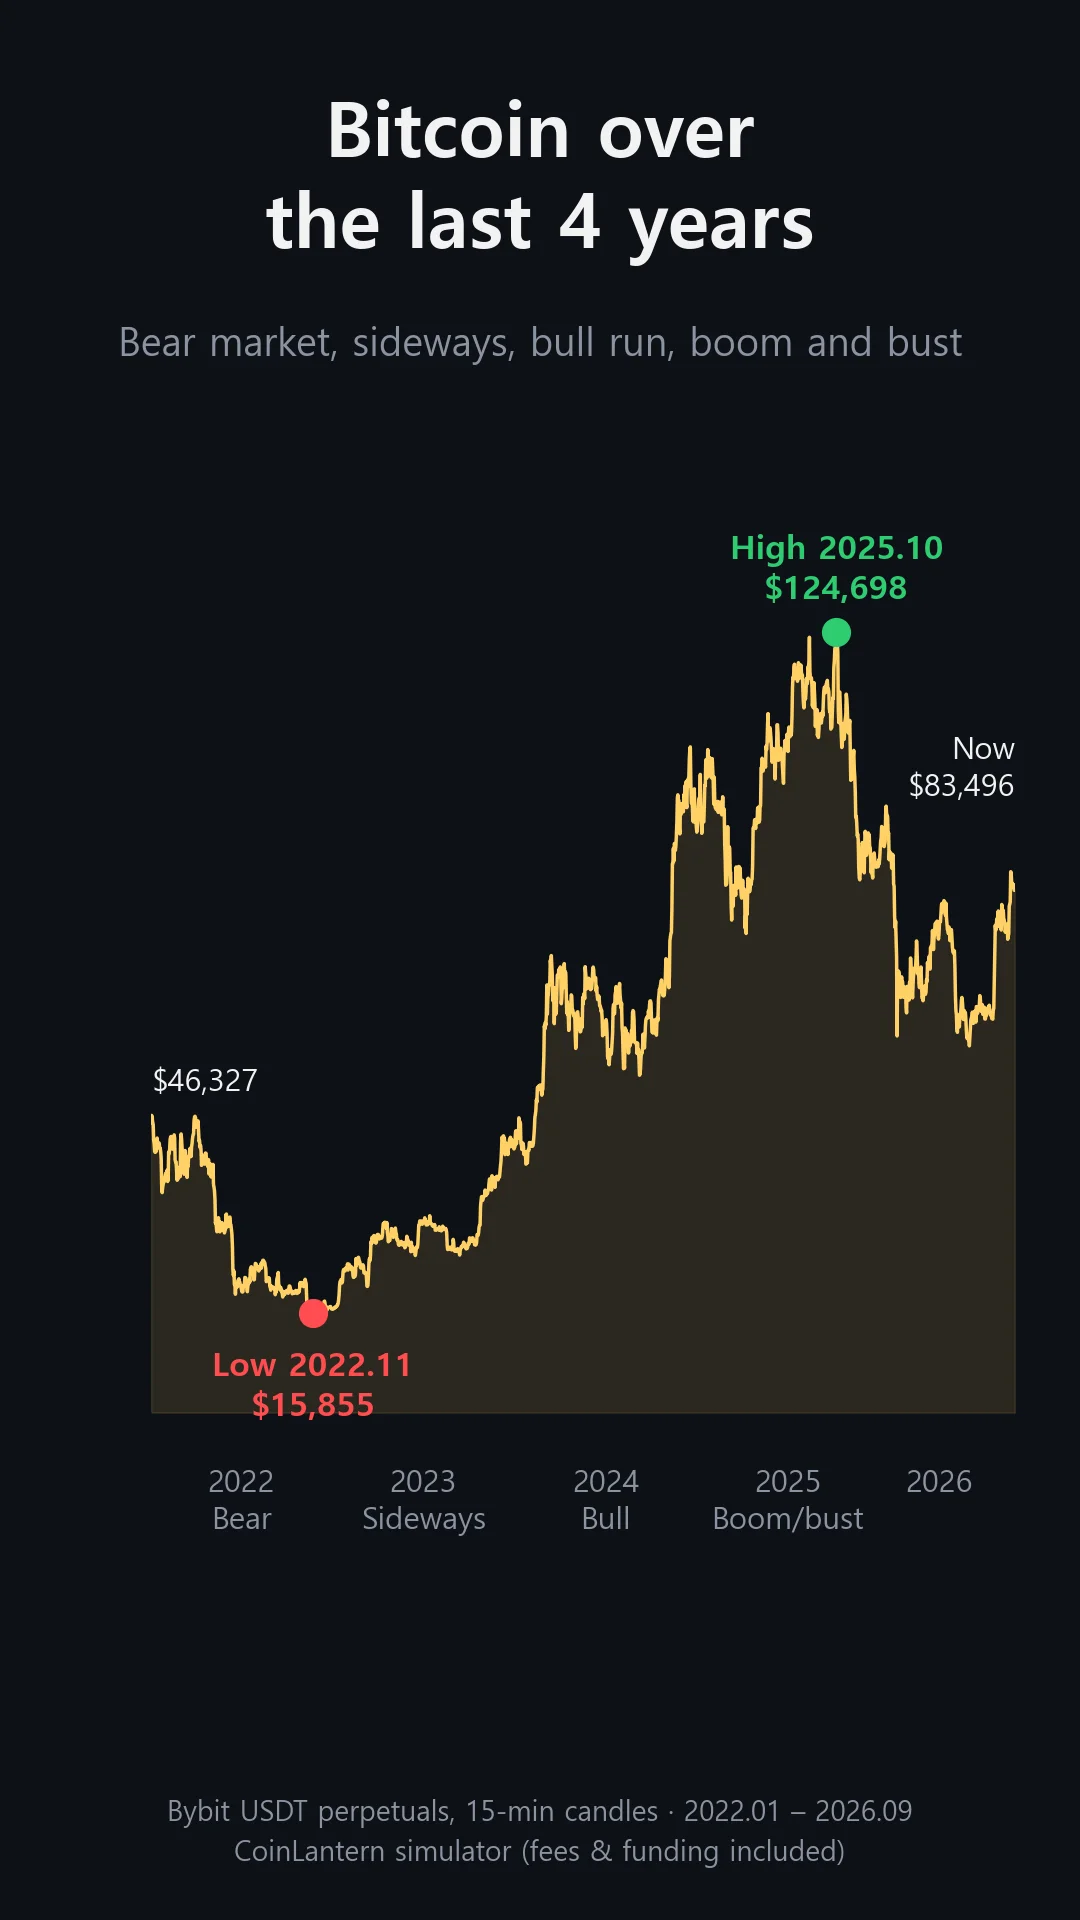
A bear market, a sideways year, a bull run and a boom-and-bust all fit inside one test window. If a strategy survives all of that, I think it's at least worth a closer look. It's statistics: if something held for four years, I assume it's fairly likely to keep behaving similarly. I try not to forget that it's an assumption.
What a simulation can't see
Good simulation results don't mean the same profits live. There are things my simulator simply can't know.
Fills, first. The simulation assumes trades fill at the 15-minute candle price, but whether you could really have entered that much at that price is unknown, especially on thinly traded coins. Time when the server was down doesn't exist in a simulation either. Neither do exchange rule changes that historical data doesn't reflect.
That's why I compare my live strategies against their simulations separately, to check that live trading is behaving the way the backtest did.
When I get an idea, I simulate it first
In practice, the moment I'm most grateful for simulation is when it lets me drop a bad strategy early. A track record that would take a year to see live, I can see the same evening.
So far I've run 505 simulations. Thirty setups made it to live trading. Most of the rest are ideas I threw away without losing a cent.
Nothing here is investment advice. Crypto is volatile, and past results don't guarantee future returns.